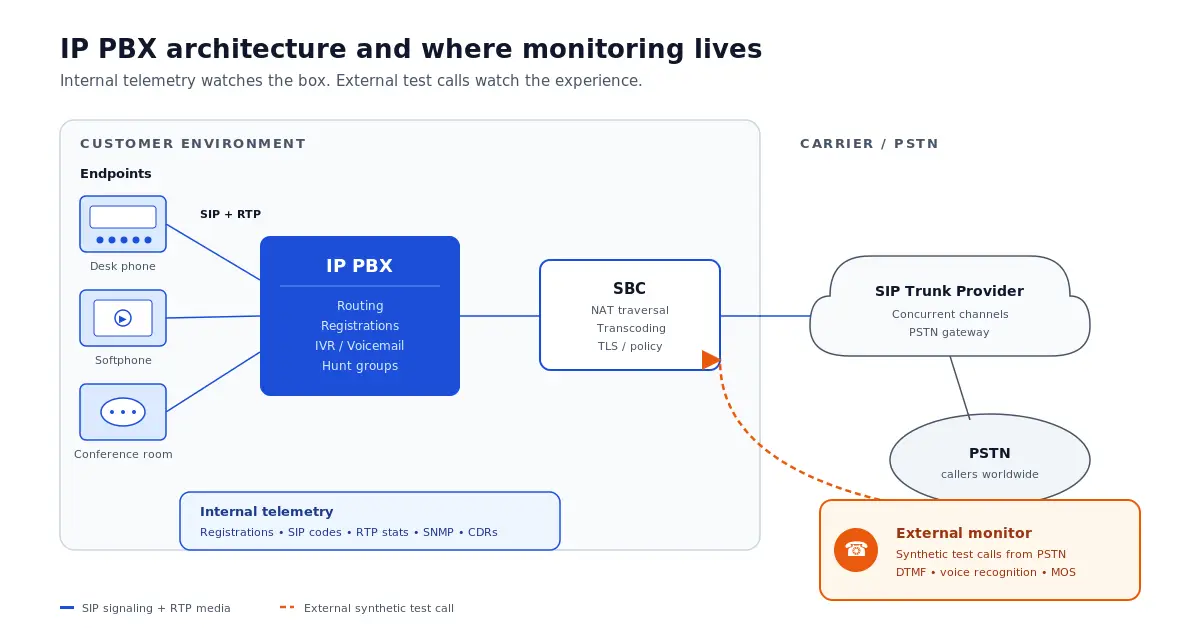
 Internal telemetry watches the PBX itself. External synthetic calls watch what the caller experiences.
Voice infrastructure has moved off purpose-built TDM hardware and onto software-defined IP PBX systems running on commodity servers or in the cloud. That shift expanded the surface area of things that can go wrong without expanding what most teams actually instrument, and it raised the bar for what IP PBX monitoring has to cover. A PBX that registers fine and reports zero alarms can still drop calls, deliver one-way audio, fail an Interactive Voice Response (IVR) menu, or lose dial tone for a region—often without any internal warning. This guide is written for IT and telecom admins who run the PBX day to day, and for the directors and CTOs who own its SLA. It walks through how an IP PBX actually works, where these systems fail in production, and the IP PBX monitoring approach that proves the phone rings—not just that the server is up.
What an IP PBX Actually Does
An IP PBX is the software successor to the legacy private branch exchange. The legacy PBX terminated copper or T1/E1 lines, switched calls between extensions, and handed external calls off to the carrier through circuit-switched trunks. The IP PBX does the same logical job—register endpoints, route calls between them, connect those calls to the public switched telephone network—but it does it in software, over IP networks, with sessions established by signaling protocols instead of physical line termination.
That change matters because every component in the path is now a network entity that can be misconfigured, overloaded, blocked by a firewall change, or knocked offline by an upstream provider. The PBX still has to register endpoints, route calls, bridge to the PSTN, and run features like IVR menus, hunt groups, voicemail, and call recording. It just does all of it across a stack with many more moving parts than its TDM ancestor.
The Components That Make It Work
SIP—Signaling and Registrations
Session Initiation Protocol is the signaling layer for almost every modern IP PBX. SIP handles the conversation about a conversation: it sets up calls, negotiates capabilities, and tears them down at the end. Endpoints—desk phones, softphones, conference room devices, ATA adapters connecting analog hardware—register with the PBX over SIP, telling it where to reach them. When a call comes in or goes out, SIP is the protocol that rings the right device, accepts the answer, and brokers the connection.
SIP carries a lot of operational signal in its response codes. A healthy system shows mostly 200-class responses on call setup. A spike in 408 timeouts, 480 unavailable, 503 service unavailable, or 5xx server errors generally means something is wrong before any caller has thought to complain.
RTP and Codecs—The Media Path
Once SIP has set up the call, the actual voice flows over Real-time Transport Protocol. RTP is where audio quality lives or dies. Packets carry encoded audio in a chosen codec—G.711 for uncompressed PSTN-grade audio, G.729 or Opus when bandwidth matters, others depending on endpoint capability. Both ends have to agree on the codec during SIP negotiation. When they don’t, calls fail or transcode through the SBC at a quality cost.
Three RTP-side metrics dominate audio quality troubleshooting: jitter (variance in packet arrival timing), packet loss, and one-way latency. Beyond a few percent loss or a few tens of milliseconds of jitter, callers start hearing artifacts, gaps, or robotic audio, and Mean Opinion Score (MOS) drops accordingly.
SIP Trunks and the PSTN Edge
SIP trunks are how the IP PBX connects to the outside world. A SIP trunking provider hands the PBX a virtual circuit over IP that can carry concurrent calls to and from the PSTN. Capacity is measured in concurrent channels (often called sessions or call paths), and trunks can be billed per-channel, metered by usage, or sold as unlimited bundles.
Trunks are a common failure point because they sit at the boundary between two operational domains, which is why SIP trunk monitoring is usually the first capability teams add when their internal PBX dashboards stop telling the whole story. If the carrier’s signaling endpoint changes, if a TLS certificate expires, if authentication credentials drift, or if the channel limit is hit during a traffic surge, the PBX will report the failure in ways that vary widely by vendor—and the customer-side symptom is the same regardless: calls don’t go through.
Session Border Controllers and Firewalls
A session border controller sits between the IP PBX and the SIP trunk (or between the PBX and remote SIP endpoints), translating between the internal network and the carrier or internet. SBCs handle NAT traversal, codec transcoding, topology hiding, and policy enforcement. They are also a frequent source of subtle problems: a misconfigured NAT rule produces one-way audio, a tightened firewall blocks RTP ports, a TLS handshake fails after a certificate rotation. The PBX itself has no visibility into those problems beyond a downstream symptom.
On-Prem, Cloud, and Hybrid Deployments
IP PBX systems land in three deployment shapes. On-premises means the PBX software runs on hardware the organization owns, typically in a data center or telecom closet, with SIP trunks delivered to that facility. Hosted or cloud PBX runs in a provider’s environment—sometimes a major UCaaS vendor, sometimes a managed services partner—and endpoints register to it over the internet. Hybrid splits the difference, often keeping survivable on-prem instances at sites that can’t tolerate a WAN outage while centralizing routing and features in the cloud. Hosted PBX testing looks the same regardless of deployment model, because the call still has to traverse the customer’s network, the carrier, and the PSTN to reach a real phone.
Each shape moves different risks out of the customer’s hands. On-prem keeps everything visible but puts operational burden on internal staff. Cloud delegates uptime to a vendor but leaves the customer responsible for everything between endpoints and the vendor’s edge—local network, internet uplink, firewall, SBC, and the carrier piece if SIP trunks are direct. The monitoring need does not change shape; only its target does.
Where IP PBX Systems Actually Fail
Real-world IP PBX failures cluster into a few recognizable patterns, and they almost never look like a single component lighting up red.
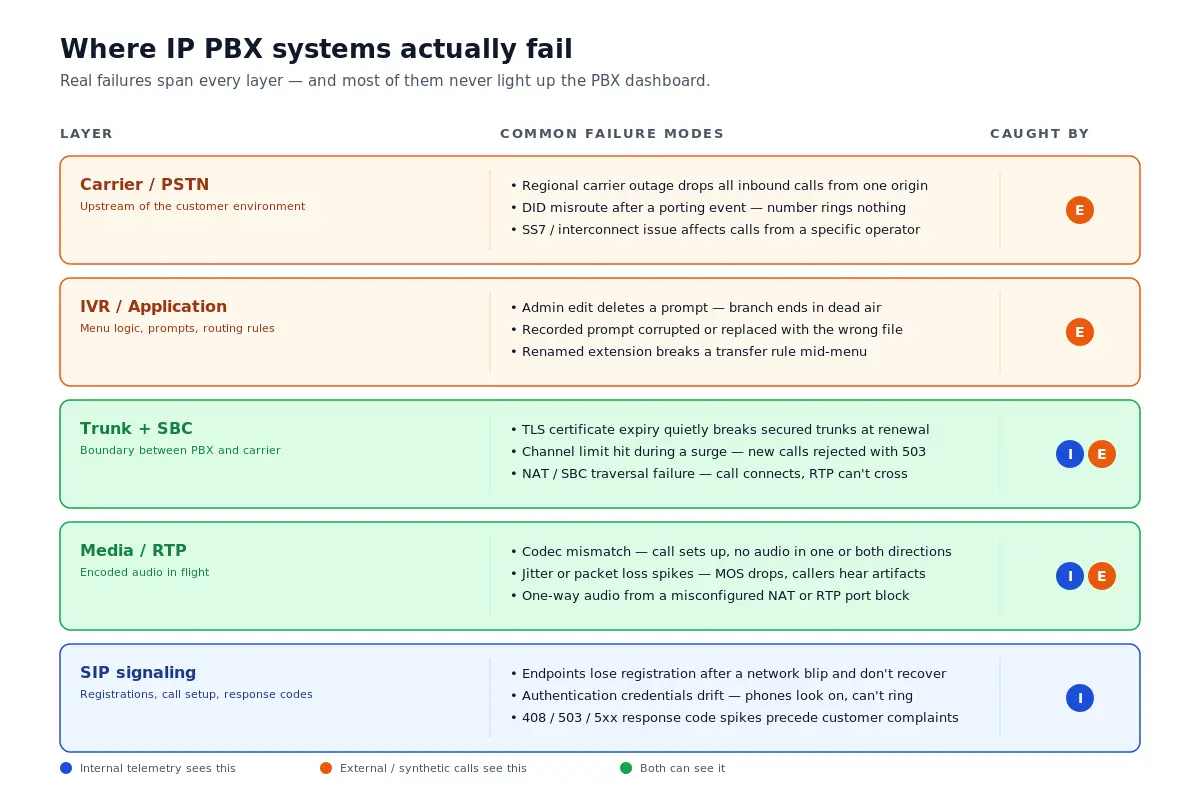
SIP registrations drift. Endpoints lose registration after network blips, then fail to re-register because of authentication issues or expired credentials, leaving phones that look powered on but don’t ring. SIP trunks hit capacity during unexpected surges and reject new calls with 503 responses while the PBX itself appears healthy. Codec mismatches between an endpoint and a SIP trunk peer cause calls to set up successfully but deliver no audio in one or both directions. NAT and SBC issues produce the same symptom from a different cause—the SIP signaling completes, the call appears connected, but RTP can’t traverse the boundary.
TLS certificate expiry quietly breaks secured trunks at the moment of renewal failure, often during a window nobody is watching. IVR menu logic regresses after admin edits—a deleted prompt, a renamed extension, a broken transfer rule—and callers reach the wrong destination or a dead end. Recorded prompts get corrupted or replaced with the wrong file. Carrier-side problems happen entirely outside the PBX’s view: a regional outage at the upstream provider, a DID that gets misrouted after a porting event, an SS7 issue affecting inbound calls from a specific origin.
Monitoring the Box: Internal Signals
Internal monitoring is the first half of the picture and it covers the components the PBX and its supporting infrastructure can introspect directly. Registration status across endpoints—how many are registered, how many have dropped, how often re-registrations occur—is the basic health signal for the SIP layer. Channel utilization on SIP trunks, plotted against the licensed or contracted ceiling, surfaces capacity problems before they become rejections. SIP response code distribution shows whether call setup is succeeding at expected rates. Where the PBX or SBC exposes RTP statistics, jitter, packet loss, and MOS estimates feed into media-quality dashboards.
Underneath, the standard infrastructure stack still applies. SNMP and host metrics from the compute layer cover CPU, memory, disk, and network on the PBX server. Log telemetry from the application surfaces application errors, authentication failures, and configuration changes. Call detail records are the audit trail that lets ops walk back a complaint to the specific call.
Internal monitoring catches a lot, but it stops at the network edge. Even where an SBC reports RTP statistics on the streams it terminates, those readings describe the segment between the SBC and the carrier—not the full path from the customer’s handset back to the IVR. Internal telemetry cannot tell you whether the dial tone reaches a customer in another country, whether the IVR plays the right prompt at the right depth, whether the audio sounds clean from the caller’s perspective, or whether the upstream carrier is dropping calls before they ever hit the trunk. For those failures, the monitor has to live outside the PBX.
Monitoring the Experience: External Test Calls
External monitoring closes the gap by approaching the PBX the way a customer does—by placing a real call from the PSTN. A synthetic test call dials the production number, waits for answer, navigates the IVR with DTMF (Dual-Tone Multi-Frequency, or touch-tone) input, listens for the prompts that should play, and measures the audio quality of the connection. The system then either confirms the journey completed correctly or alerts when it didn’t.
This is the lane Phone Number Monitoring (PNM) operates in. PNM places automated test calls against production phone numbers on a schedule the customer configures—anywhere from every five minutes to once per day—and reports on what actually happened on the line. It supports IVR tree navigation with simulated DTMF input, voice recognition against expected prompts to verify menu logic, response time and SLA measurement with per-second accuracy on connect, hold, and agent-response times, and conference-line audio quality testing using dual-line waveform comparison to score clarity, distortion, latency, packet loss, noise, and volume. It works against IVRs, hunt groups, queues, conference bridges on Zoom, Teams, WebEx and traditional providers, and any other endpoint that terminates a phone number.
Call quality monitoring from the PSTN side is the only way to score the line as a customer would hear it. Crucially, the monitor sees what the caller sees. If the upstream carrier drops the call, PNM catches it. If a certificate expiry breaks a SIP trunk and routing falls back through a slower path, PNM measures the added post-dial delay. If an admin edit to the IVR sends callers to a dead branch, PNM hits the dead branch on the next test cycle and alerts. None of those failures necessarily light up the PBX’s internal dashboards.
KPIs That Tell You the System Is Healthy
A few metrics deserve dedicated thresholds and alerting. Post-dial delay measures the time from dialing the last digit to the first ring or the answer signal. Healthy PSTN-originated PDD typically lands under three seconds; sustained PDD above five seconds is a routing or carrier problem. Answer-seizure ratio (ASR), the proportion of attempted calls that successfully connect, should sit comfortably in the high 90s for inbound business numbers, and any sustained drop is a red flag.
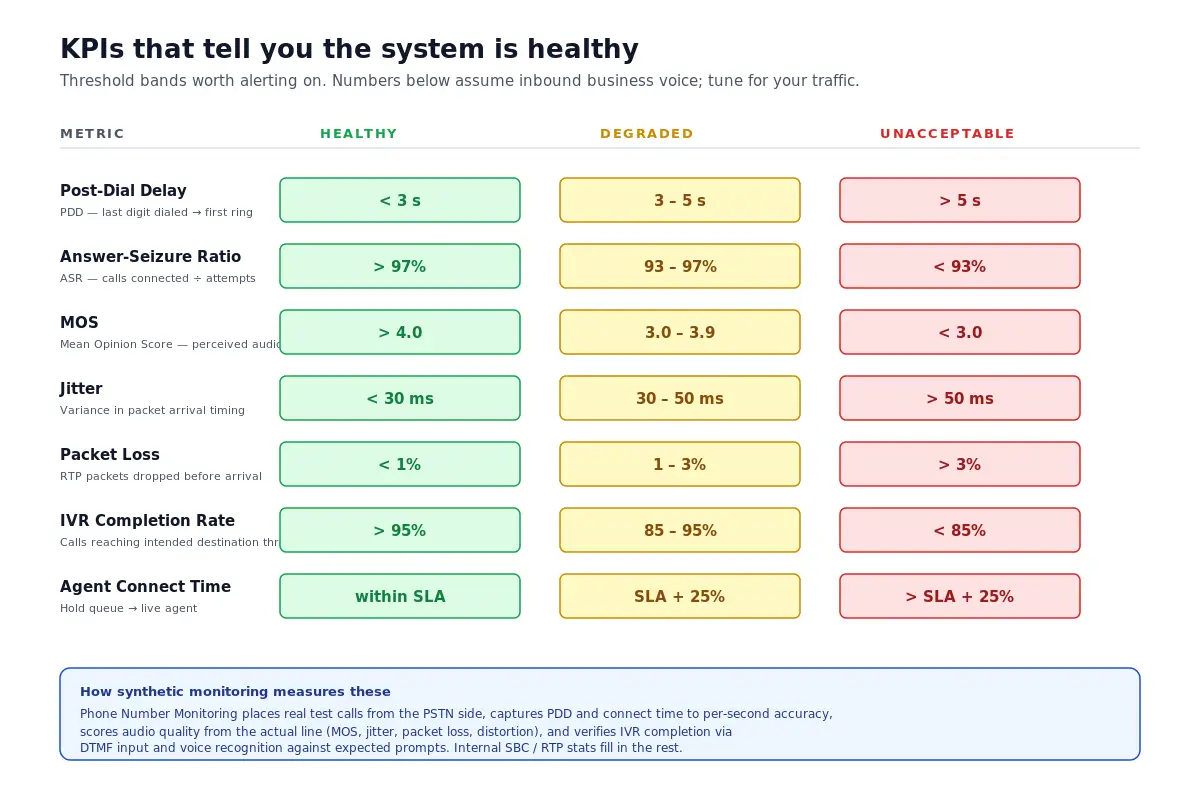
| Metric | Healthy | Degraded | Unacceptable |
|---|---|---|---|
| Post-Dial Delay (PDD) | < 3 s | 3 – 5 s | > 5 s |
| Answer-Seizure Ratio (ASR) | > 97% | 93 – 97% | < 93% |
| Mean Opinion Score (MOS) | > 4.0 | 3.0 – 3.9 | < 3.0 |
| Jitter | < 30 ms | 30 – 50 ms | > 50 ms |
| Packet Loss | < 1% | 1 – 3% | > 3% |
| IVR Completion Rate | > 95% | 85 – 95% | < 85% |
| Agent Connect Time | within SLA | SLA + 25% | > SLA + 25% |
On the audio side, MOS scores below roughly 3.5 indicate users will perceive quality issues; below 3.0 the call is generally unacceptable. Jitter under 30 milliseconds and packet loss under 1 percent are reasonable healthy thresholds, with degradation thresholds set tighter for high-stakes lines. IVR completion rate—what fraction of calls successfully reach their intended destination through the menu—surfaces logic regressions that infrastructure metrics will never see. Response time on agent connect, measured against the SLA the business has committed to, ties technical telemetry to the contractual obligation the leadership team actually answers for.
Building an IP PBX Monitoring Playbook with PNM
A working monitoring playbook starts with naming the numbers and journeys that matter. The main inbound DID, the support hotline, the after-hours queue, the conference bridge for the all-hands, the toll-free number printed on customer invoices—each gets enumerated, each gets a baseline expectation, each gets a test schedule.
From there, the playbook builds in three steps. First, define the synthetic journey for each line: what number to dial, what DTMF inputs to send, what prompts to listen for, what audio-quality threshold to enforce, what response time qualifies as a pass. Second, set the cadence. High-stakes customer-facing numbers can run every 5 to 15 minutes; internal lines and lower-volume queues can run less often. PNM’s per-line scheduling supports the full range. Third, wire the alerts. Configure alert groups so the right person hears about the right line, set escalation policies so a missed alert moves up the chain, and pick channels—phone, email, SMS—that match the urgency of each line.
For organizations with broader operations stacks, PNM’s REST API and webhook notifications let test results, alerts, and SLA reports flow into incident management, ticketing, or observability platforms alongside the rest of the telemetry. Audit trails and reporting are sufficient to support documentation requirements under HIPAA, PCI-DSS, FFIEC, GLBA, and SOX where regulated lines are in scope, which is what most teams mean when they specify PBX SLA monitoring as a contractual obligation rather than a nice-to-have.
How PNM Compares to Enterprise Call Assurance Suites
Established enterprise platforms—Cyara, Spearline (acquired by Cyara in 2023), and Hammer (Empirix, now part of Infovista)—cover the full spectrum of call testing and CX assurance, including conversational AI testing, large-scale load generation, and broad CCaaS integrations. They are the right fit for organizations whose scope includes those capabilities and whose procurement process can absorb an enterprise sales cycle.
Phone Number Monitoring is built for the core IP PBX monitoring use cases—uptime, IVR navigation, response time, and audio quality—with self-serve signup, transparent published pricing (Basic from $9.99/mo, Premium from $199.99/mo), and a 30-day free trial that doesn’t require a credit card. Most teams have their first line under monitoring in under ten minutes. PNM scales cleanly into the low hundreds of monitored lines, which fits SMB, mid-market, and regulated mid-size organizations whose voice estate doesn’t need a six-figure assurance contract.
